


Val Workman
The opinions expressed by the bloggers below and those providing comments are theirs alone, and do not necessarily reflect the opinions of Ryma Technology Solutions. As they say, you can't innovate without breaking a few eggs...

- Font size: Larger Smaller
- Hits: 29012
- 0 Comments
- Subscribe to this entry
- Bookmark
What kind of return on PM assets should you target?
One objective of product management is to maximize returns on the product management assets (ROA). What if we define an asset to be the outputs of product management activities? Are these work products an economic resource? Are they objects that are capable of being owned or controlled to produce value? Well, isn't that the point of coming up with a product feature definition, or a market requirement – to control it so that it can produce value downstream? Why, yes it is! Then these objects are product management assets. The organization has invested in their production, and it's the product management team's responsibility to maximize their return.
If each product management asset produced, delivers a maximum value, then product management as a whole delivers the sum of the whole (its maximum value). The first component of computing the ROA is a number that many organizations use to monitor performance: the operating leverage. The operating leverage of product management can be computed as:
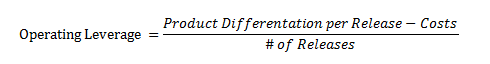
It's nice if you know the values to these factors, but it's not necessary. What we want is to be improving differentiation while reducing costs. So we're more interested in how the Operating Leverage is looking compared to last quarter than what the actual value is. Is your product management team's operating leverage positive and growing? I'll get into the details of working with the operating leverage some other time.
A second component for computing ROA is your team's asset turnover. It measures how many times in a given release the assets "turn over" in the form of a product differentiation. Assets "turn over" when they contribute to the definition to downstream assets. The asset turnover of a product management asset can be computed as:
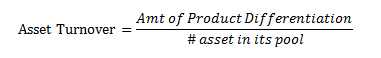
This means to maximize asset turnover, you increase its differentiation. Another way to say this is to increase its perceived value by downstream activities that consume these assets. If the assets are of poor quality, they will have a low perceived value, and therefore a low asset turnover rate. On a side note, you also want to set threshold values to limit asset pool size. If a pool gets too big, quit producing those assets.
Now let's consider a graph where I plot the operating leverage on the y-axis and the asset turnover rate on the x-axis as shown below. I now can compute my targeted ROA. Let's say my product management asset currently has an operating leverage and asset turnover rate shown by the red dot at (2.5, 1%). Let's also say I want to target an average return on my assets of 20%.
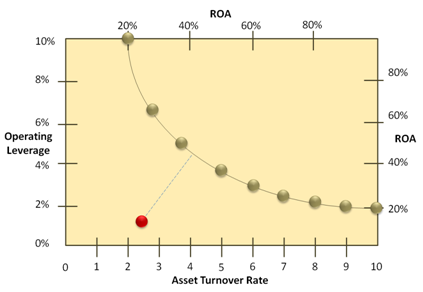
I draw a targeted 20% line on this graph (I'll explain why and what it means in a minute), I compute 20/2=10, and I plot the result at (2, 10%) on the graph. 20/3=6.66 and plot that at (3, 6.66%). 20/4=5 and this is plotted at (4, 5%) and so on until you see the line shown above. Each of these points represent of a ROA of 20%. This curve contains all the possible combinations of asset turnover rates and operating leverage that can produce an ROA of 20%. You can draw similar curves for any other targeted ROA, say 30% or even 80%.
Now we draw a line from our current ROA (the red dot located at 2.5, 1%) to the ROA curve. This is a point on the ROA curve that represents the shortest path, as shown as a dashed line. The point where this dashed line hits the targeted 20% line (by just eyeballing) is (4, 4.5%). This means that the quickest and easiest way for your product management team to get to the 20% ROA for this particular asset is to raise the asset turnover to from 2.5 to 4 by increasing the amount of quality assets produced, and it's operating leverage from 1% to about 4.5% by adding more differentiation in each release, which typically means more excitement requirements at lower costs.
This ROA curve offers handy guidelines for figuring out where to put the team's priorities in process and capability improvement.


